Archived writing · retained for reference.
From Price Information to Maker Decisions in BTC Five-Minute Markets
Eren Ege Çelik
Independent quantitative researcher
Working draft for feedback, version 0.3 - 14 September 2026
Abstract
Can a maker convert observed BTC price information into positive expected trading value once order activation, queue access and inventory are accounted for? This paper examines that question in historical five-minute binary markets. Brownian-probit estimation describes price formation, while a 358-record feature study distinguishes contemporaneous explanation from information available at entry. The book response is strongly directional: after Binance moves of at least $5 over 200 ms, 87.05% of non-fizzled first responses agree, with a median correct-confirmation delay of 275 ms. Yet a static front-quoting candidate evaluated with 50 ms order activation has fresh-data expected value of -0.9845 cents per eligible moment, with a 90% interval of [-1.626, -0.364], even before an unmeasured additional fill cost is charged. A joint-fill EV decomposition explains why paired fills and unmatched inventory require different decisions. An inventory-aware policy improves on its baseline by 68.50 cents per slot across 368 recorded simulator outputs, but queue, quantity and online decision-availability assumptions remain unresolved. The evidence identifies both a rejected quoting rule and conditional inventory-policy value. Its central implication is that a strong price-to-book relationship leaves execution and inventory as separate empirical questions. The study does not establish live profitability or transfer its point-settlement results to an averaged payoff.
Keywords: binary contracts; market microstructure; market making; volatility estimation; inventory risk; execution modeling; prediction markets.
1. Introduction
A maker observing a BTC price move faces a sequence of decisions: whether a resting quote has become exposed, whether a replacement can reach the book in time, and what to do if only one side fills. A five-minute binary payoff makes these questions particularly connected. The same underlying displacement can change the contract probability, attract a fill and leave inventory whose terminal risk differs from that of the underlying asset.
The research question is whether observed price information retains positive maker value after those execution and inventory constraints are included. The empirical answer has two parts. A strong directional book response coexists with the rejection of a specific static front-quoting rule on fresh data. Inventory-aware decisions improve recorded simulator outcomes, but the replay leaves material questions about accessible fills and decision times. These findings explain why identifying the direction of repricing does not, by itself, determine a profitable quote.
The study follows one chain of evidence. Pricing estimation establishes what the feed explains and which inputs are available when a decision is made. Arrival-clock and queue measurements then establish how a candidate order encounters the observed market. Finally, joint-fill EV and binary inventory accounting connect the resulting exposure to a policy. The contribution is this measured connection and its documented failure points; the Gaussian probability map and the underlying utility framework are standard.
The work covers historical Polymarket BTC up/down markets during May-July 2026. The pricing, response and policy investigations use different sampling units and partly different periods. They support the chain of reasoning without forming a single pooled profitability test. Sections 3-4 define the available price information, Section 5 examines execution access, Sections 6-7 derive the inventory decision, and Section 8 evaluates the historical candidates. Implementation versions and campaign history are collected in Appendix C. The public repository provides reference code, selected features and recorded outputs, with the reproduction boundary for each result stated in Appendix B.
1.1 Related work and the scope of comparison
Interpreting a prediction-market price as a probability requires assumptions about beliefs, preferences and trading constraints. Manski [L1] and Wolfers and Zitzewitz [L2] provide different formal perspectives on that interpretation. Here, the observed midpoint is a measured price; a diffusion-model probability and a fitted market-price description are separately defined objects.
Semenas [L3] studies closely related short-dated BTC binaries using a lognormal digital-option pricing reduction and a buffered fair-value entry rule. His 182-contract, two-day sample has positive realized point estimates, but reported intervals include zero, the model does not improve on market probability scores, and an edge-threshold selection fails out of sample. His volatility estimator and ranking score are outside the disclosed specification. Our study develops the pricing-scale estimation and maker-specific measurement layers, then evaluates joint-fill and inventory decisions. The samples and execution evidence differ, so their numerical returns are not used as a performance benchmark for this paper.
Avellaneda and Stoikov [L4] connect inventory preferences to market-making quotes through an execution model. Their distinction between reservation value and trading opportunity motivates the payoff-specific calculation in Section 6. Glosten and Milgrom [L5] explain how informed trading can generate a spread and conditional selection effects. These frameworks motivate the questions; they do not validate our fill proxies, identify a participant's strategy or supply an economic conclusion for the historical implementations.
2. Contract, data and evaluation units
2.1 Historical instrument and notation
The studied contract has a 300-second window with start time and expiry . Let denote the contractual reference and its starting observation. The historical research models the UP payoff as and the DOWN payoff as . A complementary pair pays one dollar. The precise tie convention belongs to the individual contract rules; a continuous diffusion assigns zero mass to an exact tie. A complete archived rule snapshot is not included in the public data release.
Write for an explanatory exchange feed, for the observed UP midpoint in dollars, and for remaining seconds. A feed-self anchor can describe market-price formation without being the contractual strike. A persistent difference between and is not, by itself, a tradable pricing error. Except where cents are specified explicitly, prices and terminal payoffs below are in dollars per share. One tick in the study is one cent.
The work concerns point settlement. The author subsequently reported a move toward averaging in the settlement rule. This paper makes no claim about its exact transition date or weighting formula and does not apply the point-payoff equations to an averaged payoff.
2.2 Research inputs and their boundaries
Table 1. Main evidence packets. Counts refer to different sampling units and are not additive.
| Packet | Period / sample | Public evidence and evaluation |
|---|---|---|
| Pricing model card | May-June; 340 fitted slots | Archived model comparisons; earlier-fit/later-log candidate evaluation |
| Scale-feature cache | May-June; 358 slots, five logs | Complete selected cache; seven fixed models refitted with leave-one-log-out scoring |
| Hybrid reference comparison | 478 reported slots; separate 60-slot class replay | Historical descriptive reports from different implementations |
| D4 response study | June-July; 13,782 events at the $5 threshold | Archived conditional summaries and placebo outputs |
| D7 fill study | 867 FULL slots; 59,376 side-specific virtual touch joins | Archived queue/depletion and censoring measurements |
| D12 grown fresh block | 312 eligible moments in 193 slots | Aggregate decision evidence; original slot-cluster uncertainty reported |
| W policy audit | 18-21 July; 368 common slots in eight tapes | All matched simulator-output rows; paired comparisons and bootstrap recomputed |
The later recorder stores exchange ticks, UP/DOWN book updates and trades with arrival timestamps. The main event studies use the recorder's receive clock; source timestamps are retained as additional metadata. Receiver-clock lags include unequal delivery delays and are not direct measurements of another trader's internal computation time.
The public extraction retains the entire 358-row feature cache and every common W slot in the specified output snapshot. It does not select favorable observations after observing their scores or P&L. Source hashes and extraction rules identify the inspected files. They cannot authenticate collection or prove that a later inspected source revision generated an earlier output.
2.3 Evaluation targets
Four targets recur: transformed-price fit, probability forecast score, conditional event response, and policy income. A transformed is not a directional success rate. A mid-price RMSE is not a trading return. A cents-per-decision estimate becomes cents per slot only after the number, quantity and interaction of decisions are specified. The W simulator uses a five-share base clip; its cents-per-slot results should not be compared directly with D12's cents-per-eligible-moment estimate.
The research sequence used fresh chronological blocks, permutations and interval estimates, but was adaptive across experiments. It was not a single globally preregistered strategy search. Each reported comparison retains its own selection procedure and interpretation.
3. Constructing the pricing model
The first step is to determine what the observed feed explains about the contract price. A model that reconstructs that price can inform a maker's response to new information; using it as an outcome forecast requires a separate evaluation.
3.1 A diffusion probability and a fitted price description
Under an ideal driftless arithmetic Brownian model,
has units dollars per square root second. Equation (1) is a conditional probability under the specified law. Calling it an arbitrage-free venue price would additionally require a pricing measure and an appropriate replication/friction argument. The empirical model instead fits the observed market midpoint with an effective scale , lag , and displacement :
The market-implied scale need not equal physical future volatility. It may absorb specification error, reference composition and features of the observed price process.
For interior mids, the transformation
gives and for a positive slope. The effective anchor is . This intercept interpretation matters: changing the anchor can remove a systematic basis that would otherwise look like persistent model-market disagreement.
3.2 Feed, lag and anchor diagnostics
The model-card pipeline samples books on a 50 ms grid, retains quote age, excludes mids at least eight seconds old and studies seconds 30-270 of each slot. Exact boundary reference anchors are required by this pipeline even for feed-self fits. Per-slot regressions use approximately one-second spacing, mids between 0.05 and 0.95, at least 40 points and displacement sum of squares dollars squared.
Candidate feeds include individual exchanges and synchronized composites. Lag comparisons use earlier feed changes and changes in transformed mids, with within-slot correlations aggregated in Fisher-z space. Exclusive-event checks ask whether the book responds when one candidate changes and an alternative does not. The archived card's strongest reported synchronized Coinbase/Binance association has a receiver-clock peak near 300 ms. This supports an explanatory feed candidate; a midpoint does not reveal an individual maker's private feed or algorithm.
An oracle-anchor fit produced a reported displacement near -$54, whereas feed-self anchoring brought the median near +$0.6. The change diagnoses a basis/specification problem. It does not measure a $54 arbitrage. Synchronized composites are also distinct from the alternating last-tick concatenation that later generated false spike signals (Section 5).
3.3 Price-fit results and the constant-scale comparison
Table 2. Archived pricing-card results. The first rows are within-slot fitted summaries; the later-log rows use a separate pooled error statistic.
| Measurement | Value | Interpretation |
|---|---|---|
| Median transformed probit | 0.919 | IQR [0.838, 0.963], 340 fitted slots |
| Median fitted probit mid RMSE | 2.81 ticks | Same-slot fitted scale and intercept |
| Median fitted logistic mid RMSE | 2.84 ticks | 340 fitted slots |
| Median fitted clipped-linear mid RMSE | 4.40 ticks | 313 qualifying slots; different eligible count |
| Later-log RMSE: selected constant scale | 11.06 ticks | Inner validation selected |
| Later-log RMSE: dynamic candidate | 5.92 ticks | Earlier-fitted coefficients; candidate favored after this comparison |
| Later-log RMSE: one-second mid persistence | 3.05 ticks | Uses lagged market mid; different information set |
Later-log forecasts use the feed-self anchor with ; within-slot family comparisons estimate both slope and intercept. The dynamic candidate is , where is the population standard deviation of one-second increments of the cached median(Coinbase, Bitstamp, Kraken) over , with coefficients fit on May 26-28 logs and evaluated on June 5-6 and June 9. Inner validation actually preferred the constant rule: median absolute implied-scale error was 1.13 versus 1.30 for the dynamic candidate. Selecting the dynamic rule after seeing its 5.92-tick later-log error uses that comparison for selection. It is therefore inappropriate to label the final choice an untouched six-tick OOS result.
The persistence benchmark also places the pricing result in context. A structural model can describe the underlying-to-binary mapping while predicting a nearby market midpoint less accurately than the market's own recent value. These errors concern price reconstruction with specified information sets, not a common executable trading opportunity.
4. Estimating scale and maintaining a hybrid reference
4.1 Feature formation and availability
The scale-feature cache contains 358 fitted slot records across five source logs. Its target is estimated at actual book-event times with zero lag, rather than the model card's lagged grid. The displacement uses the synchronized Coinbase/Binance mean. In contrast, its one-second feature series is the median of Coinbase, Bitstamp and Kraken. These series have distinct roles. The feature extractor applies its own point-count, displacement and positive-scale filters; it does not implement the model card's book-age exclusion.
The within-slot range is the maximum minus minimum over . The pre-slot range uses . The first is partly contemporaneous with the scale target and unavailable at entry. The second is measured up to the slot boundary. The cache's annualized DVOL feature is converted to dollars per square root second, but its collector associates an hourly close with the bar's timestamp. That close's point-in-time availability is not established. Flow features are normalized signed Binance volume imbalances over trailing windows; capped pagination leaves their original completeness unverified.
4.2 Fixed candidate comparison
For each of seven historical linear feature specifications, ordinary least squares includes an intercept. Leave-one-log-out (LOGO) validation estimates coefficients on four logs and evaluates the fifth, pooling squared errors across omitted logs:
Here is the cached fitted target and its held-out-log prediction. Training may include later logs when testing an earlier one. The folds therefore measure cross-log transfer, not chronological OOS. The historical selection rule requires LOGO , first-feature coefficient variation below 20% and maximum VIF below five, then ranks eligible models on the same LOGO scores. The winning score is a validation result.
Table 3. Recomputed archived-feature scores, all 358 rows and seven fixed candidates. Flow variables are absolute normalized imbalances; no new model search is performed.
| Features | In-sample | LOGO |
|---|---|---|
| Within-slot range | 0.345 | 0.271 |
| Pre-slot range | 0.134 | 0.082 |
| Within-slot range + DVOL | 0.383 | 0.321 |
| Within-slot range + flow 30 s | 0.350 | 0.270 |
| Within-slot range + DVOL + flow 30 s | 0.387 | 0.320 |
| Pre-slot range + DVOL + flow 30 s | 0.235 | 0.196 |
| Within-slot range + DVOL + flow 2 min | 0.384 | 0.318 |
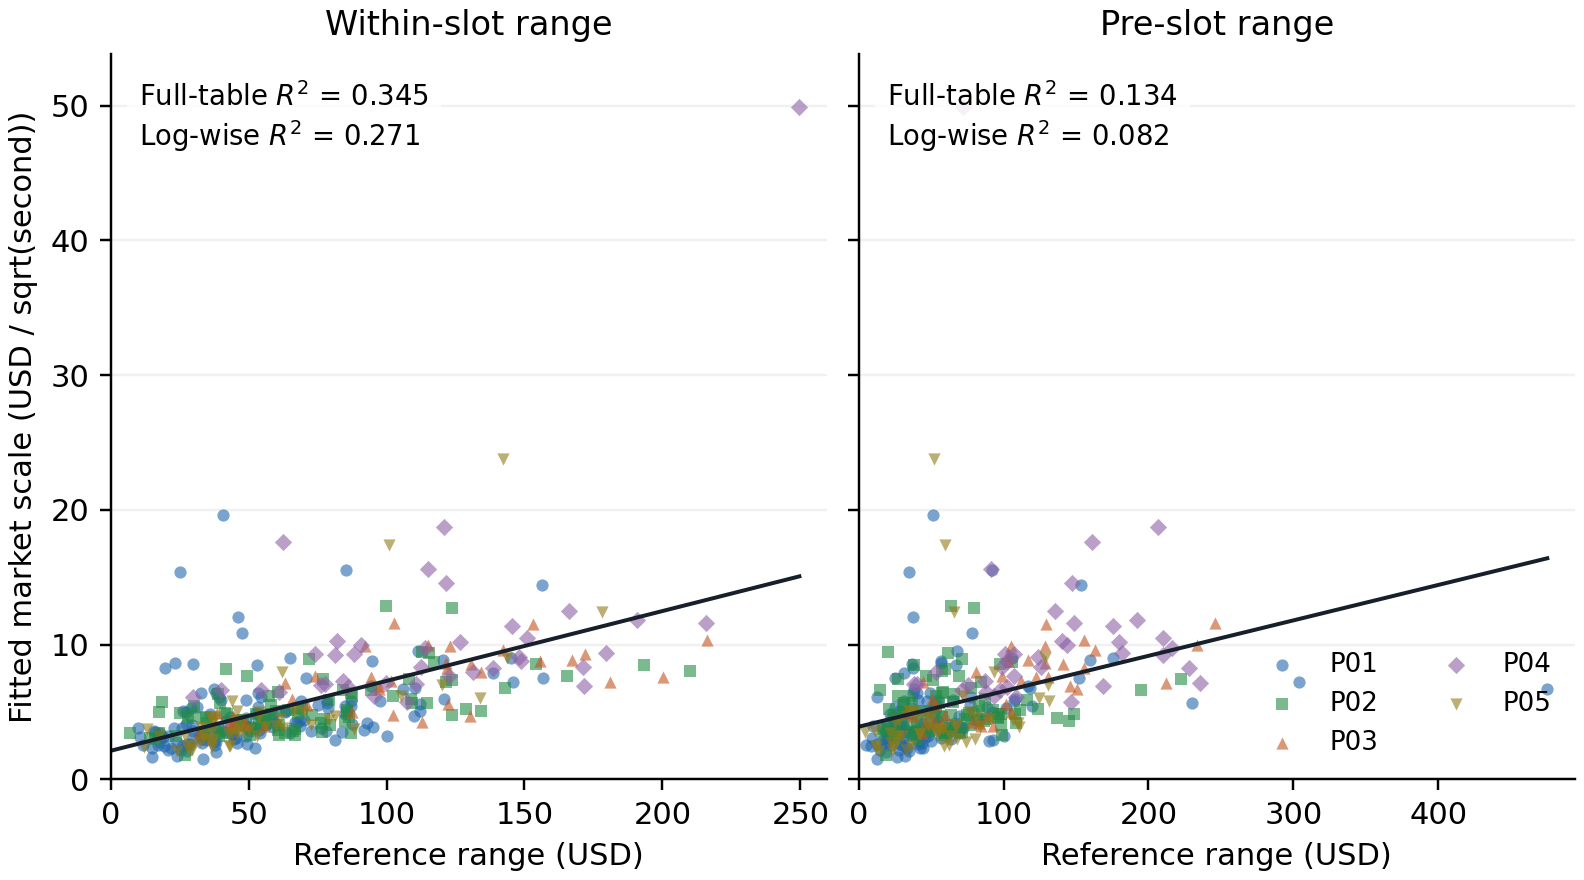
Figure 1. Cached market-implied scale and two range features. Lines are full-table OLS fits; colors identify the five source logs. All 358 records are shown. The within-slot feature ends 150 seconds after entry. The plot describes an archived feature relationship, not an entry-time forecast or a raw-tape reconstruction.
The recovered full-cache range rule is ; the range is in dollars and scale in dollars per square root second. The within-slot range explains more of the fitted scale than the pre-slot range. DVOL improves the validation score under its unverified timing convention. These are informative results about model structure and data availability; neither provides a causal trading validation. The archived feature-study probability diagnostic is also distinct: point-weighted Brier scores were 0.1819 for the range model and 0.1812 with DVOL, against approximately 0.175 for the market. Repeated outcomes and full-data fitted features limit the interpretation of those historical scores.
A later study changed the target to subsequent realized feed volatility. It split 1,137 slots into 568 fit and 569 evaluation observations. The historical range rule was within 20% of realized scale in 28% of evaluation slots, versus 33% for a refit. Its best reported feature had evaluation , but was selected on that evaluation half. An improved description of market-implied scale cannot be assumed to solve physical volatility forecasting.
4.3 Slow basis, fast changes and the cached state
Execution research needed a reference anchored to the contractual level while reacting to the faster exchange feed. Hybrid v1 rebased at each reference observation :
Every new reference tick could consequently inject a composition/basis change into a short-term signal. Hybrid v2 instead smoothed with a 20-second time constant:
A separate 15-second gap baseline gives a high-pass state:
The gap starts at its first observation, so its initial high-pass output is zero. It resets each slot; the slow basis persists. The scalar is measured in cents per share and supplies timing/direction state, while executable quote levels remain book-derived.
The historical v2/v3 implementations use different offset and volatility updates. Their descriptive comparisons, sample counts and cache behavior are retained in Appendix C.1. They do not constitute a common out-of-sample pricing experiment.
5. From feed events to observable book mechanics
The next step is access. An observed repricing relationship matters to a maker only through the orders that can remain, activate or cancel while the market responds. The following measurements therefore retain the event clock, conditioning set and hypothetical queue convention.
5.1 Clock discipline and health
An as-of join uses the latest observation received no later than the specified cutoff, with an explicit maximum age. Availability and validity are separate: an empty book update proves that the recorder received a message, although it may not provide a valid two-sided quote. Treating invalid messages as absent can inflate apparent outage duration.
The later clean index classifies a 280-second within-slot window . If is the union of book gaps strictly longer than and the recorded tape span, coverage is
Windows with less than half their duration recorded are excluded. FULL requires coverage at 1.5 seconds of at least 95% and both boundary anchors. OK8 applies the same criterion at eight seconds when FULL fails. Missing anchors and poor coverage have separate states. A FULL slot can still contain local breaks that terminate a particular event window. The archived B05 packet has a 41 ms median book interval, 9.37% of elapsed book-stream time inside gaps longer than two seconds, and a maximum gap of 33.5 seconds. Older overviews rounded a different snapshot to roughly 32 seconds.
Alternating latest ticks from two venues with a stable basis creates artificial jumps. The subsequent event-signal programme uses Binance alone. UP and DOWN records are also normalized to a common economic side before analysis, without counting mirrored book liquidity twice. Arrival health does not detect a frequently updating but frozen price value; the later paper-engine investigation identified that additional failure mode.
5.2 First response and conditional confirmation
D4 defines a qualifying Binance displacement over 200 ms, thresholds of $3, $5 or $8, and a one-second deduplication rule. It samples FULL slots at offsets 10-200 seconds, uses an as-of book no older than 0.5 seconds and scans up to three seconds for the first nonzero midpoint move. A gap above 1.5 seconds ends the scan. An opposite first move remains wrong-direction even if a later response agrees. No move before the horizon or break is a historical fizzle.
At the $5 threshold, the archive has 13,782 events and 3.11% fizzles. Among non-fizzles, 87.05% of first moves agree with the feed direction, against 49.48% for the random-time, random-direction placebo. Median delay among correct confirmations is 275 ms. The reported 65.23% confirmation rate within 400 ms is conditional on eventual correct confirmation. Consequently the approximate unconditional probability is
which gives 55.02% at 400 ms from the rounded $5 fields. These denominators express different questions and should not be interchanged.
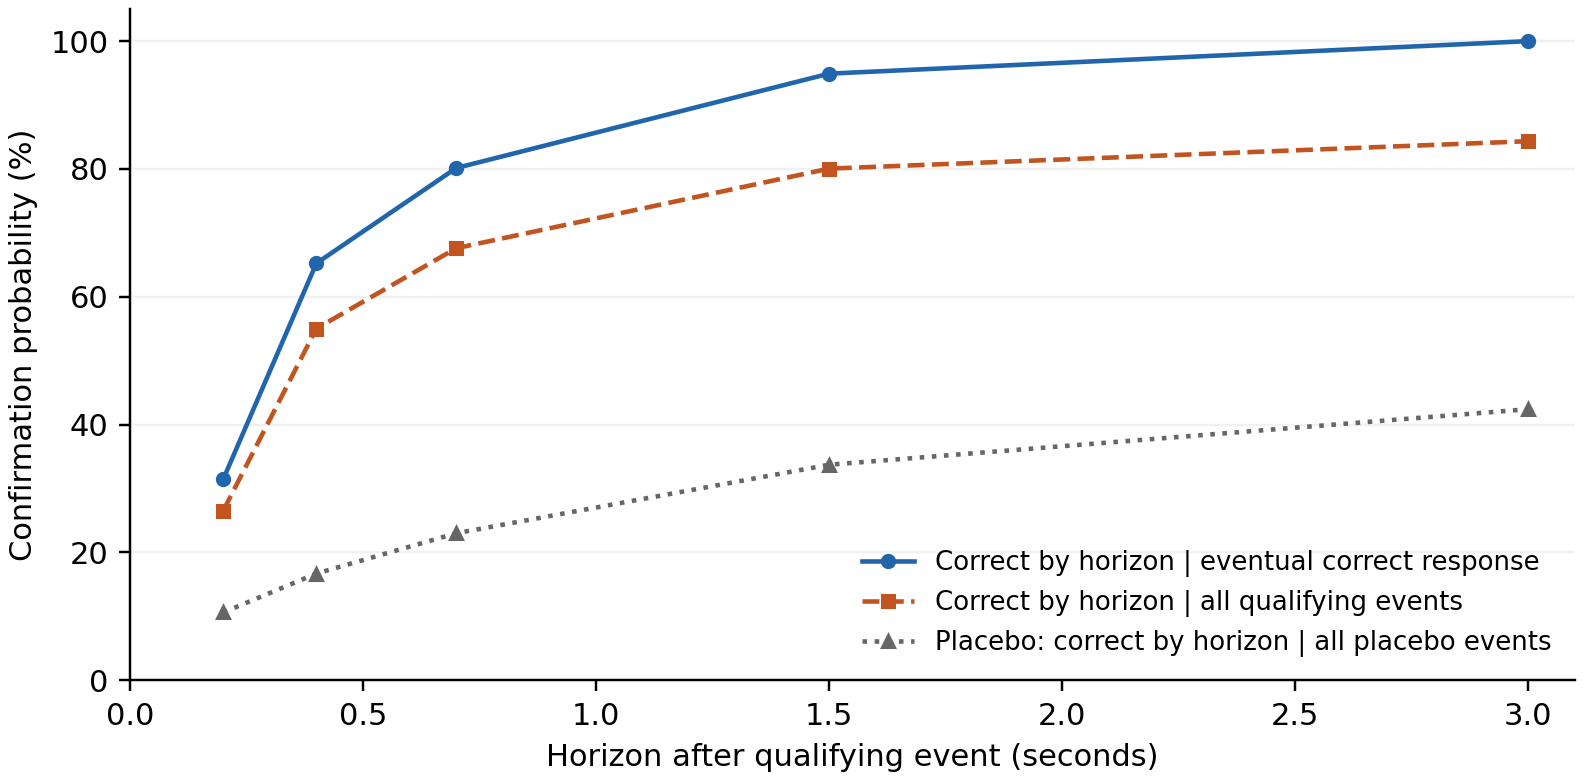
Figure 2. Archived D4 $5 confirmation summaries at the stored horizons. Conditional confirmation is measured among eventual correct responses; the unconditional approximation also includes fizzles and wrong-direction first responses. Values are joined for orientation; the archive does not provide a full continuous-time CDF or pointwise uncertainty. The placebo uses its own conditioning and is not an executable-return benchmark.
D4b studies the subsequent size of the book response. It groups events by future realized one-second feed displacement and finds decreasing book response per dollar: at two seconds after confirmation, the ratio falls from about 0.716 cents/$ in the $3-5 bucket to 0.311 in the $20-and-above bucket. Because bucketing uses future displacement and requires a direction-correct response, this is an explanatory saturation measurement. It is not an entry-time signal or proof that the residual response can be captured.
D14 is a separate calm-to-spike study with a different first-move definition and a 280 ms median. Its pre-spike calm window excludes the spike's own 200 ms displacement interval. The distinction matters: a superficially similar response estimate can arise from a different conditioning set and observation horizon.
5.3 Queue walks, censoring and the flow model
Level-2 data does not reveal the queue rank of a counterfactual order. The replay therefore walks hypothetical orders through displayed depth and later prints. A trades-only convention credits side-matched trades; a second convention additionally credits unexplained size drops. These are sensitivity scenarios, not proven bounds on actual fills: cancellations ahead, replenishment, hidden priority and response to our own order are unknown.
Let be visible depth ahead, trailing side/price-specific flow in shares per second, and a horizon. D7 investigates and an exponential fill model . Its archive contains 59,376 virtual joins across 867 FULL slots. In the trades-only convention, 84.6% are censored, chiefly by a change in the touch. At horizon , both numerator and denominator include only observations with independently computed capacity . Short-capacity observations are excluded even if they filled early. This estimates fill frequency conditional on sufficient observation capacity, not unconditional fill probability under established non-informative censoring.
The fitted model's discrimination is preserved after permuting trailing flow: 0.4077 with the real input and 0.4156 after permutation. It also overpredicts some middle buckets. A stable fitted coefficient does not establish useful flow information. Later controls perturbing wall size further clarify the source of discrimination. The policy consumes empirical lookup tables, while the retained composite bucket does not prove that adds predictive value beyond depth.
Historical D7 queue walks start at the decision instant and do not include POST activation latency. The subsequent D12 economics study applies the 50 ms correction; D7 curves therefore are not activated-order fill probabilities.
5.4 Activation and the actual execution route
The maker decision baseline is 50 ms for activation and 50 ms for cancellation. Historical maker POST measurements were 24-50 ms and cancellation medians 23-50 ms; 218 ms is a cancellation tail under load. The 250-330 ms figures refer to the taker path. These intervals measure different operations and cannot be substituted for one another.
An order cannot consume trades before its activation time. A cancel request leaves exposure until modeled removal. Correcting activation in the front experiment removed much of its apparent opportunity. Acknowledgment, effective cancellation and observed fill reconciliation remain separate execution events.
The inspected maker prepares token metadata outside the quote callback, but builds and signs its post-only order during submission. It buys complementary tokens to represent UP-book bids and asks. Appendix C.2 traces the cache versions and explains how that route differs operationally from selling pre-split inventory; the accounting must be matched to the actual route.
6. Binary inventory risk and reservation value
Execution can leave one leg unmatched even when both initial quotes were attractive. Its value then depends on the binary payoff and the existing position, which motivates the inventory accounting below. The reservation-value calculation clarifies that exposure; actual quote levels in the studied policy continue to come from the book.
For cash , UP holdings , DOWN holdings and imbalance ,
Matched pairs have a certain payoff. At a fixed probability, the unmatched terminal variance has no separate maturity multiplier; it is not constant along a path because changes.
Under the matched constant-volatility assumptions of (1), Itô's formula gives
The cancellation of holds after conditioning on the same probability; the underlying scale still determines the displacement-to-probability map. At , reducing remaining time from 100 seconds to one second multiplies instantaneous binary diffusion by ten. Yet integrated future quadratic variation satisfies
Today's diffusion squared times remaining time need not equal (12). A stochastic fitted scale in (2) also introduces additional drift/variation terms and does not inherit the martingale identity automatically. Appendix A supplies the constant-parameter derivatives.
Avellaneda-Stoikov's Brownian frozen-inventory center is [L4, equations 6-8]. For a one-dollar Bernoulli payoff, the corresponding frozen-inventory certainty equivalent can instead be calculated directly. Let be risk aversion in inverse dollars:
The exact one-share indifference bid and ask are
For small and fixed inventory,
Thus the familiar Bernoulli inventory adjustment is an approximation, rather than an exact finite-inventory quote rule. At , , , (14) gives approximately 0.487505 and 0.512495 dollars. Execution quotes additionally require queue access, arrival behavior, ticks and operational constraints. This exact calculation is explanatory work added to clarify the historical argument; the implemented policy did not quote around an A-S reservation center.
7. From joint fills to an inventory-constrained policy
7.1 Four outcome values
Use UP-book coordinates in cents. Let be an ask, a bid and the decision mid, giving , and . Selling DOWN at cents is economically represented by the synthetic bid coordinate. An A fill reduces signed UP exposure; a B fill increases it.
Write , and . Feasible branch weights require
The empirical adjustment uses projected onto this interval. The frozen is a joint-fill multiplier, not a correlation coefficient. Conditioning does not impose a universal sign on the covariance of regime-specific fill probabilities.
Let be historical maker rebates. The observed signed drifts are for A and for B; denote the mean drift-cost inputs used in EV. The selector estimates regime-conditioned means from the corresponding JOIN fills and treats them as representative of unmatched branches. That transfer is a modeling approximation, not an exact empirically estimated A-only/B-only conditional mean. Rewards and EV in the following table use cents per paired unit; probabilities are dimensionless.
Table 4. One-decision branch accounting. Additional cost applies to unmatched fills.
| Outcome | Probability | Reward |
|---|---|---|
| Both | ||
| A only | ||
| B only | ||
| Neither |
The paired value is the weighted sum:
The identity equals mark-to-mid trading value plus rebate. Adding a quote-price markout to again would double-count the spread. For single-side actions, and ; their sum need not equal because completing both legs removes unmatched drift exposure.
For quote/execution price in dollars, the historical rebate model is cents per share, with zero maker fee; terminal taker flattening uses cents per share. These are study accounting assumptions, not a current venue schedule. They are separated from trading income.
7.2 State, continuation value and implemented policy
A full event-driven control formulation would contain regime, outstanding quotes, queue state, signed inventory and slot phase, with a random next-event time :
The older MDP2 implementation evaluated policy families through a generative chain and uncertain measurement links. Its Monte Carlo frequency of positive EV was conditional on the supplied parameter distributions, not a calibrated posterior probability of profitability. The later EVM policy uses a one-step decision estimate and inventory rules. Neither solves the full continuation value in (18).
The D8 baseline quotes a five-share clip at stable-book decision windows, joining a narrow book or improving each side by one tick when the spread is at least three cents. Maker activation and cancel delays are 50 ms. A qualifying Binance move triggers cancellation of the threatened side; the book provides a fallback. An inventory clamp prevents exposure-increasing quotes at , and residual inventory is flattened at 200 seconds.
D11 adds maker rebalancing (REB). At a settle boundary with and no new baseline episode, it quotes the reducing side for the imbalance. Controls include immediate taker unwind, drift-based episode skips and matched-frequency random skips. These distinguish the value of obtaining a maker exit from the effect of simply reducing participation.
D15 evaluates every settle window using A+B-frozen fill and drift tables. With small inventory, it selects the feasible positive maximum of . At larger imbalance, it forces a reducing quote even when its one-step value is negative; an exposure-increasing clip remains optional and constrained. REB is therefore a risk rule, not an optimized continuation term. The paired-unit value is not used as a valuation of unequal rebalancing quantities.
Regime uses the trailing 1.5-second Binance move: absolute displacement below $3 is calm, at least $8 is directional, and the intermediate region is neutral. Drift calibration conditions on decision-time regime. Front marginal fill rates, however, transfer from front-calm calibration, and JOIN drift/joint estimates are reused for front quoting. Ten-second fill estimates rank variable-duration windows. These transfer assumptions remain part of the model.
8. Policy evidence and revisions
The decisive comparisons ask whether the measured information supports a particular action. The static front candidate tests the value of obtaining a short-lived quoting position. The inventory-policy comparison tests how modeled outcomes change when actions account for which side may fill and the exposure already held. Their estimates have different denominators.
8.1 Static front quoting: a favorable-cost rejection
The D12 static front-calm experiment studies clean FULL slots at offsets 10-200 seconds, sampling paired opportunities every 50 book events. Calm requires absolute as-of Binance displacement below $3 over 1.5 seconds. Two-sided one-tick improvement requires a spread of at least three cents. The hypothetical front opportunity ends when the observed book occupies the improved level, subject to a ten-second maximum and local validity constraints. Fills cannot begin before 50 ms activation.
Unmeasured additional cost enters the unmatched channel monotonically:
For and , the zero is . If , nonnegative cannot rescue the fixed candidate. This argument is conditional on eligibility, fill and drift estimation; it does not validate those inputs.
Table 5. Archived D12 decision evidence. Units: cents per eligible decision moment.
| Sample or sensitivity | EV(0) |
|---|---|
| Discovery A | +0.3383 |
| Discovery B | +0.4325 |
| Grown fresh F | -0.9845 |
| Fresh 90% slot-cluster interval | [-1.626, -0.364] |
| Chronological final 30% | -0.9989 |
| Final 30%, frozen analytic model | -0.3772 |
| Fresh, most favorable single-slot omission | -0.8792 |
The grown fresh block covers 312 moments in 193 slots. Its interval lies below zero even at the favorable boundary, and no single omitted slot restores the sign. The decision rejects this static candidate within the represented model. The chronological split and fresh block are related checks, not independent replications. The public verifier reapplies the decision rule to stored aggregate values; it does not reconstruct the original confidence interval or event selection.
8.2 Inventory policies: matched simulator-output comparisons
Earlier D11/D15 campaigns motivated the inventory mechanism; their separate counts and reported intervals are retained in Appendix C.3. The reproducible comparison below uses the W snapshot.
The available W snapshot instead contains 368 common slots from eight tapes on July 18-21. The public audit matches base, REB, EVM and scrambled EVM one-to-one and retains every matched slot with FULL status. For pair it computes and the arithmetic mean. A fixed-seed bootstrap resamples whole paired slots 2,000 times, reporting the linearly interpolated fifth and 95th percentiles. This is a recorded-output recheck; it does not simulate new fills or correct the historical producer.
Table 6. Recomputed W paired differences, 368 slots. Units: cents per slot at the historical five-share base clip, including modeled rebates and flatten costs.
| Difference | Mean | Paired 90% interval |
|---|---|---|
| EVM - base | +68.50 | [39.35, 95.17] |
| EVM - REB | +58.78 | [33.05, 82.62] |
| EVM - scrambled EVM | +26.51 | [12.63, 40.80] |
| REB - base | +9.72 | [-4.72, 23.72] |
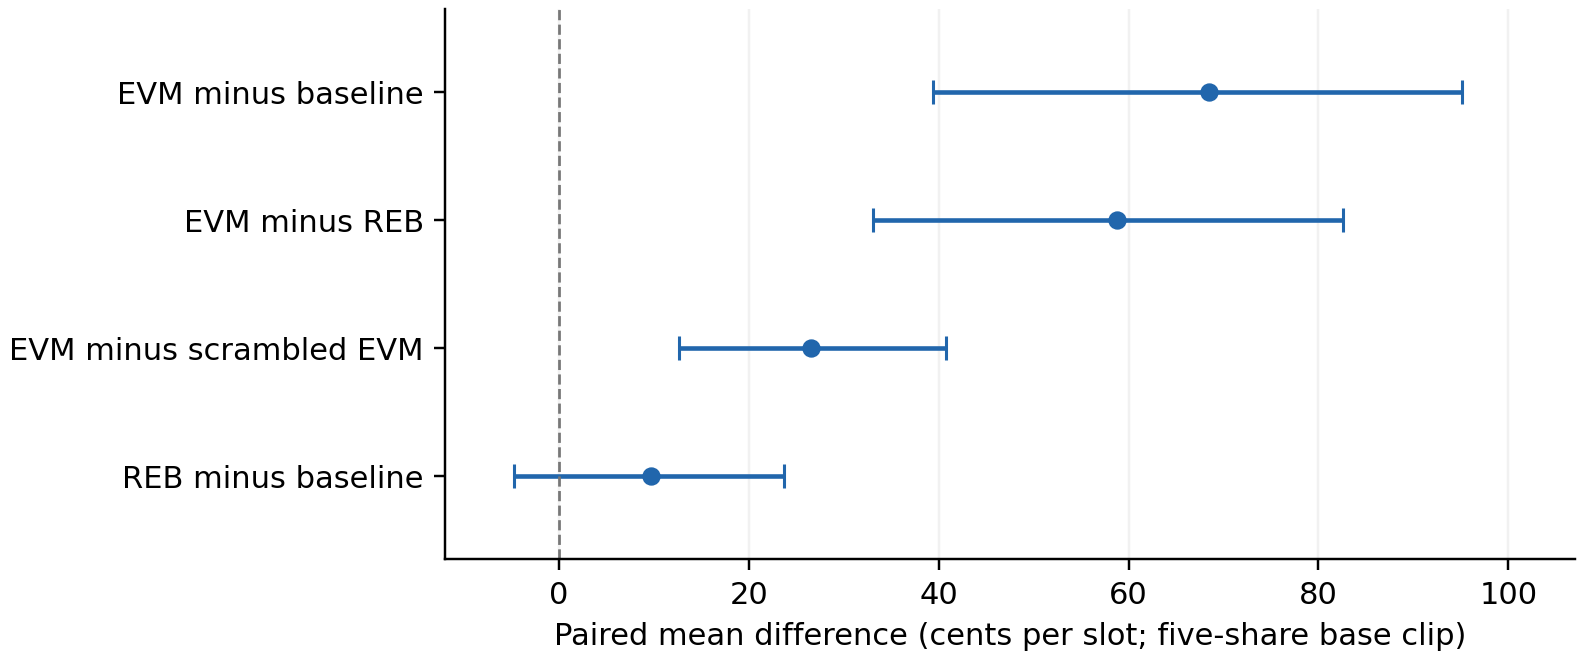
Figure 3. Means and paired 90% slot-bootstrap intervals from all 368 common W outputs. Scrambled EVM preserves placement and inventory mechanics while swapping regime labels. Intervals measure variation of recorded simulator outputs and do not include queue-model, quantity or online decision-availability uncertainty. REB-minus-base includes zero in W, unlike the earlier pooled D11 report.
The EVM comparison contains both structural and regime-conditional components. Quoting every eligible window and managing unmatched inventory differ from the baseline; the scrambled comparison holds more of that structure fixed. It is one deterministic label swap, not an exhaustive randomization distribution. Per-tape summaries and a descriptive chronological 70/30 split are included in the audit, but do not create another untouched test after reviewing the whole W block. Slot resampling does not model dependence between neighboring slots.
8.3 What the positive replay does not identify
Several implementation details materially bound interpretation. The historical REB walk uses fill timing independent of the requested imbalance, then credits the full quantity on a proxy fill. Same-window fills are evaluated from starting inventory without an intra-window adaptive decision. Front probabilities and drift inputs transfer between conditions that were calibrated separately.
Decision availability is an additional issue. The replay reconstructs settle groups using future touch-event gaps shorter than 0.5 seconds and references entry to the group's last event. An online process cannot know at that event that the group has ended. The replay does not establish equivalent online availability after the required confirmation delay. Positive W values therefore remain conditional outputs of the historical simulation, rather than executable upper bounds with every timing assumption already established.
The public component enforces the missing lower Fréchet bound, preserves real zero calibration values and separates unknown state from neutral. Those are explicitly documented corrections. The archived W results are not attributed to a rerun with the corrected component.
8.4 Paper-engine discrepancies as diagnostic evidence
A same-window stress comparison found that the paper engine and replay did not share critical conditions. Cold-start state, stale values, inventory caps and configuration mismatches affected the paper engine. These failures prevent a clean economic comparison and identify what an execution validation must reconcile. Appendix C.4 preserves the campaign-specific figures and distinguishes this episode from earlier invalid runs.
9. Reproducibility and limitations
The public package supports analytical checks, selected-feature refits and a matched simulator-output audit. Appendix B identifies the exact source revision, commands and reproduction boundary. These operations verify specified calculations; they do not reconstruct all unpublished observations.
The most significant limitations concern identification and execution. A price fit does not identify a participant. A sample selected through a model cannot by itself validate the model's probability interpretation. A visible trade need not have filled our counterfactual order. Full-slot health does not ensure every subwindow is usable. The historical samples cover limited regimes, and repeated researcher choices complicate the interpretation of the strongest selected comparison.
Publication source hashes pin inspected inputs; they are not cryptographic proof of historical collection. Some code evolved after a stored output was produced. The publication records identify this distinction rather than assigning a false exact producer. Full raw-tape reconstruction, independently audited instrument rules and quantity-aware, causally scheduled execution comparisons would strengthen the evidence. No new trading experiment is implied by this document release.
10. Discussion and conclusion
The research question was what maker value remains after observed price information is passed through execution and inventory constraints. The evidence gives a bounded answer. A compact pricing model explains much of the observed price surface, and the book commonly moves in the direction of an already-observed feed displacement. Neither result prevents a specified front quote from having negative expected value after activation and conditional fill costs are included. The fresh-data rejection of that candidate is therefore compatible with the strong response study.
Inventory decisions change the question after a fill. Completing a pair removes a different risk channel from carrying one side, and the four-outcome EV decomposition makes that distinction explicit. The recorded W comparisons support the usefulness of that structure within their simulator. They do not establish the quantity that would have filled or the online availability of the reconstructed decision windows. The next evidential step for an economic claim would be quantity-aware execution at causally available decision times, with matched policy comparisons.
For this study, the defensible findings are the price-formation measurements, the rejection of the fixed front candidate and the conditional inventory-policy comparisons. The analytical and software contributions make the transitions between them inspectable. This provides a concrete answer to the motivating problem: knowing how the book responds is useful information, while the value of acting on it must still be established at the order and inventory level.
Appendix A. Binary diffusion and utility identities
For and ,
The drift is zero. Multiplying by gives (11); Itô isometry for the bounded martingale gives (12). With a known deterministic volatility schedule, replace by . The diffusion coefficient becomes . A fitted stochastic scale requires additional terms and a separately specified model.
For exponential utility , buying one share at preserves utility when , giving (14). Selling one share at requires . Expanding the logarithm of the Bernoulli moment-generating function yields (15). The risk-neutral limit is and . The public implementation retains tilted probabilities in log space so that a large risk-aversion increment cannot erase a numerically small but recoverable tail.
Appendix B. Reproduction route and source map
The technical release at revision 6db010205b3aa3b8b4ee1d5715e06c47de8023b7 includes
126 tests covering accounting, causality, probability constraints, estimation and policy
behavior. A clean GitHub checkout passed those tests, 14 example/audit invocations and
19 published-file hash checks. These are software and release checks; statistical
validity does not follow from a passing test suite.
Table B1. What a reader can reproduce from the public package.
| Layer | Public operation | Remaining boundary |
|---|---|---|
| Analytical components | Pricing transform, diffusion, terminal moments, exact CARA values | Assumptions determine applicability |
| Pricing feature study | Refit seven candidates on 358 cached rows | Original observations and point-in-time feature formation not reconstructed |
| Mechanics | Audit conditional summaries and selected health classifications | Event selection, original placebo estimates and most uncertainty remain archived |
| Policy | Evaluate synthetic states with frozen calibration; recheck 368 matched outputs | Historical fill paths, queue access and execution capacity not regenerated |
| D12 verdict | Apply the decision rule and byte-check the committed result | Original aggregate estimator and raw tapes remain upstream |
From the repository root, the following use Python 3.10+ and its standard library:
python -B examples/pricing_walkthrough.py
python -B examples/risk_walkthrough.py
python -B examples/microstructure_walkthrough.py
python -B examples/policy_walkthrough.py
python -B estimators/mechanics_audit.py
python -B estimators/policy_audit.py
python -B estimators/d12_public_verifier.py --check
python -B -m unittest discover -s tests -v
The figure builder uses the same published feature and policy functions plus optional matplotlib. Figure inputs and output hashes are recorded in figure provenance. Paper build instructions describe Markdown-to-PDF generation. Building the manuscript does not rerun private market collection or any operational service.
Table B2. Technical and empirical source map.
| Paper sections | Public method / evidence |
|---|---|
| 3-4, C.1 | Pricing construction, estimation, pricing record |
| 5, C.2 | Data engineering, market response, queue mechanics, mechanics record |
| 6, Appendix A | Binary risk derivation, risk code |
| 7-8, C.3 | EV chain, policies, experiment history, policy record |
| 8.1 | D12 aggregate, decision summary |
| 8.4-9, C.4 | Simulation coverage, reproducibility, publication manifest |
Appendix C. Implementation and campaign details
C.1 Hybrid implementations and descriptive diagnostics
The historical 478-slot diagnostic reports hybrid-v2 level/change correlations of 0.959/0.414, compared with 0.954/0.028 for tick-rebased v1. That diagnostic used a fixed per-tick offset weight of 0.05; the implemented class used elapsed-time weights, and its separate 60-slot replay reported level correlation 0.928. The versions should not be combined into one experiment.
The inspected later class already contains v3 refinements: reference differences use a two-second lagged feed, with a current-feed fallback, and scale becomes . Scale updates are cached on accepted samples at least one second apart, retaining at most 901 samples and requiring 120 before replacing the initial value. Under sparse arrivals, that buffer spans more than 15 minutes. Reading fair value uses buffers and scalar state; it does not refit a regression or rescan the volatility history on every quote decision.
C.2 Submission preparation and inventory routes
The shared client evolved from v1 SDK-cache warming into explicit v2 per-token metadata, version and collateral-balance preparation, dispatched concurrently outside the quote callback. The inspected crypto maker warms new outcome tokens at slot transition and uses cached tick/negative-risk options. Its GTC post-only order is still built and signed during submission in an executor thread. Shared pre-sign/FAK helpers exist but are not called by that route. This source trace establishes where preparation occurs; it does not establish an unmeasured end-to-end speedup.
That executor buys UP for an UP-space bid and buys DOWN at for an UP-space ask. Its complementary acquisition route differs operationally from selling pre-split inventory. Both can be expressed through signed UP exposure, but balance requirements, collateral reservation and fill mechanics must be mapped separately. The accounting in Sections 6-7 is an economic coordinate system, not evidence that every historical executor used the same order path.
C.3 Earlier policy comparisons and sample boundaries
Earlier D11 and D15 reports motivate the inventory mechanism. In the 1,013-slot A+B+F report, REB improved on base by 10.9 cents/slot, CI90 [2.5, 19.5]. The later EVM-minus-REB comparison was 67.8 [53, 82]. A grown fresh F=371 comparison reported EVM-minus-base 83.8 [56.5, 111.7]. These are different historical reports; their original common per-slot archives are not regenerated in this paper.
C.4 Defective execution campaigns as diagnostics
A same-window comparison found approximately +$21 in replay against approximately -$31 in a six-slot paper-engine stress segment. Investigation identified cold-start regime blindness, stale-value handling, inventory-cap behavior, loss-limit rearming and configuration mismatches. Because the paper implementation was defective, the discrepancy does not estimate the economics of a clean live strategy. It identifies conditions that the replay and implementation failed to share.
An earlier 157-slot A/B comparison is a separate campaign invalidated by incorrect execution assumptions. An older generative-chain calibration also involved a run with 78.4% balance rejects; reproducing its funnel was a mechanics check. These observations are retained as research diagnostics, not merged with the W output recheck into a live performance record.
References
- [L1] Manski, C. F. (2006). Interpreting the predictions of prediction markets. Economics Letters, 91(3), 425-429. Working-paper record.
- [L2] Wolfers, J. and Zitzewitz, E. (2006). Interpreting prediction market prices as probabilities. NBER Working Paper 12200. Primary record.
- [L3] Semenas, J. (2026). Fair Value Pricing in Short Dated Bitcoin Binary Markets: A Single Window Evaluation of a Candidate Statistical Arbitrage Edge. Working paper, July 2026. SSRN record; author-hosted full text.
- [L4] Avellaneda, M. and Stoikov, S. (2008). High-frequency trading in a limit order book. Quantitative Finance, 8(3), 217-224. Author-hosted paper.
- [L5] Glosten, L. R. and Milgrom, P. R. (1985). Bid, Ask, and Transaction Prices in a Specialist Market with Heterogeneously Informed Traders. Journal of Financial Economics, 14(1), 71-100. Columbia research record.
Author and development note
The research is by Eren Ege Çelik. AI coding and writing assistants were used in implementation, documentation and preparation of this manuscript. This working draft is hosted for reading and methodological feedback. It has not been submitted to a journal or peer reviewed. The exact CARA exposition and public implementation corrections are identified as publication additions. Feedback is particularly useful on pricing-scale identification, feature availability, censoring, quantity-aware fill modeling and causal reconstruction of decision times.