Trading and research
Weather daily-max markets
Daily-maximum temperature markets: live trading, observation pipelines, probability models and execution.
Role
Independent researcher
Period
2026
Stack
Python · Async HTTP · Kalman filtering · Monte Carlo · Execution
Venue
Prediction markets
What I built
I traded daily-maximum temperature markets, built observation and execution components, and researched how a new station reading or forecast should change outcome probabilities. The work connects four problems:
- Acquisition: turn NOAA station TXT and MGM JSON responses into identifiable observations, with source-specific polling and persistent HTTP connections.
- Inference: update a temperature state using forecasts, METAR and private weather stations, then simulate the remaining day's maximum.
- Decisions: evaluate portfolio payoff and risk across temperature outcomes, including BUY, SELL, HOLD and report-conditioned actions.
- Execution: prepare metadata, balance and signed orders before a report arrives, so the event path can select and submit a prepared action.
Collection, probability research and execution evolved in different versions. The contribution map connects each part to its implementation and evidence.
Acquisition and execution timing
The historical architecture placed NOAA collection in Virginia and execution in Ireland, with
separate MGM collectors. Persistent httpx connection pools amortized TCP/TLS setup across polls.
NOAA used concurrent polling with a batch-delivery barrier; MGM workers could deliver independently
as requests completed. Those choices determine when an already fetched observation reaches a consumer.
I separated source observation time, local receipt and order response. The public parsers retain the official METAR temperature separately from MGM's decimal field, and make duplicate, corrected and late observations explicit. The extraction documents where this behavior improves on older versions.
On the execution side, historical v1/v2 client work moved metadata and balance fetching, order building and signing before the trigger. Later wrappers added parallel warmup, caches and connection keepalive. The public call trace shows which operations remain on the prepared submission path. A separate probe decomposes DNS, TCP, TLS and HTTP response time; historical regional measurements explain the deployment choice, with request-level reproduction limits stated. An HTTP response is not a confirmed fill.
Architecture · Parsers and polling · Execution and caches · Latency measurements
From a temperature state to an action
The scalar filter pulls the latent temperature toward the forecast between observations. Updates use source-specific noise and bias adjustments. Monte Carlo paths produce a daily-maximum distribution; separate calculations describe the next report and daily outcomes conditional on that report.
The decision layer uses mutually exclusive settlement scenarios to compute portfolio expectation,
variance and covariance. It ranks feasible actions by E[PnL] - lambda * Var(PnL), alongside
deterministic rules for temperature buckets made impossible by an observation. This is a one-step
decision evaluator with a separate market-reaction heuristic. The derivation documents approximations
in the conditional distributions and distinguishes them from an exact dynamic-programming solution.
Model equations · Decision equations and code
What the empirical work found
I examined sensor information, parameter fitting and outcome forecasting as separate questions:
- Parameter fitting: across 28 markets, selected settings reduced Brier score by 24.35% on average relative to defaults, averaging market-level percentage changes. Selection and comparison used the same days.
- Sensor ablation: in the Warsaw default grid, adding the sensor reduced pooled ranked probability score by 17.02% over 552 snapshots. Both arms were refitted on the same 92 days.
- Historical outcome scoring: a replay using a substituted forecast source scored 5,104 snapshots across 177 city-days. Model-minus-market Brier was +0.0579, with a 95% city-day interval [+0.0332, +0.0825]; the market scored better on that sample.
These studies distinguish useful model changes from forecasting performance against market prices. The public audit recomputes selected scores from compact historical extracts. It also covers daily features, production-journal comparisons and pre-METAR diagnostics, with separate sample definitions. The final calibration report described an undeployed configuration; historical and live forecast providers differed.
Calibration and ablations · Experiment records
Follow a recorded day
The public companion replays an Istanbul observation sequence from 11 June 2026. It processes 1,165 input events: 1,097 private-weather-station readings, 26 METAR observations and 42 forecast records. A reader can inspect how the temperature posterior and daily-maximum probabilities evolve.
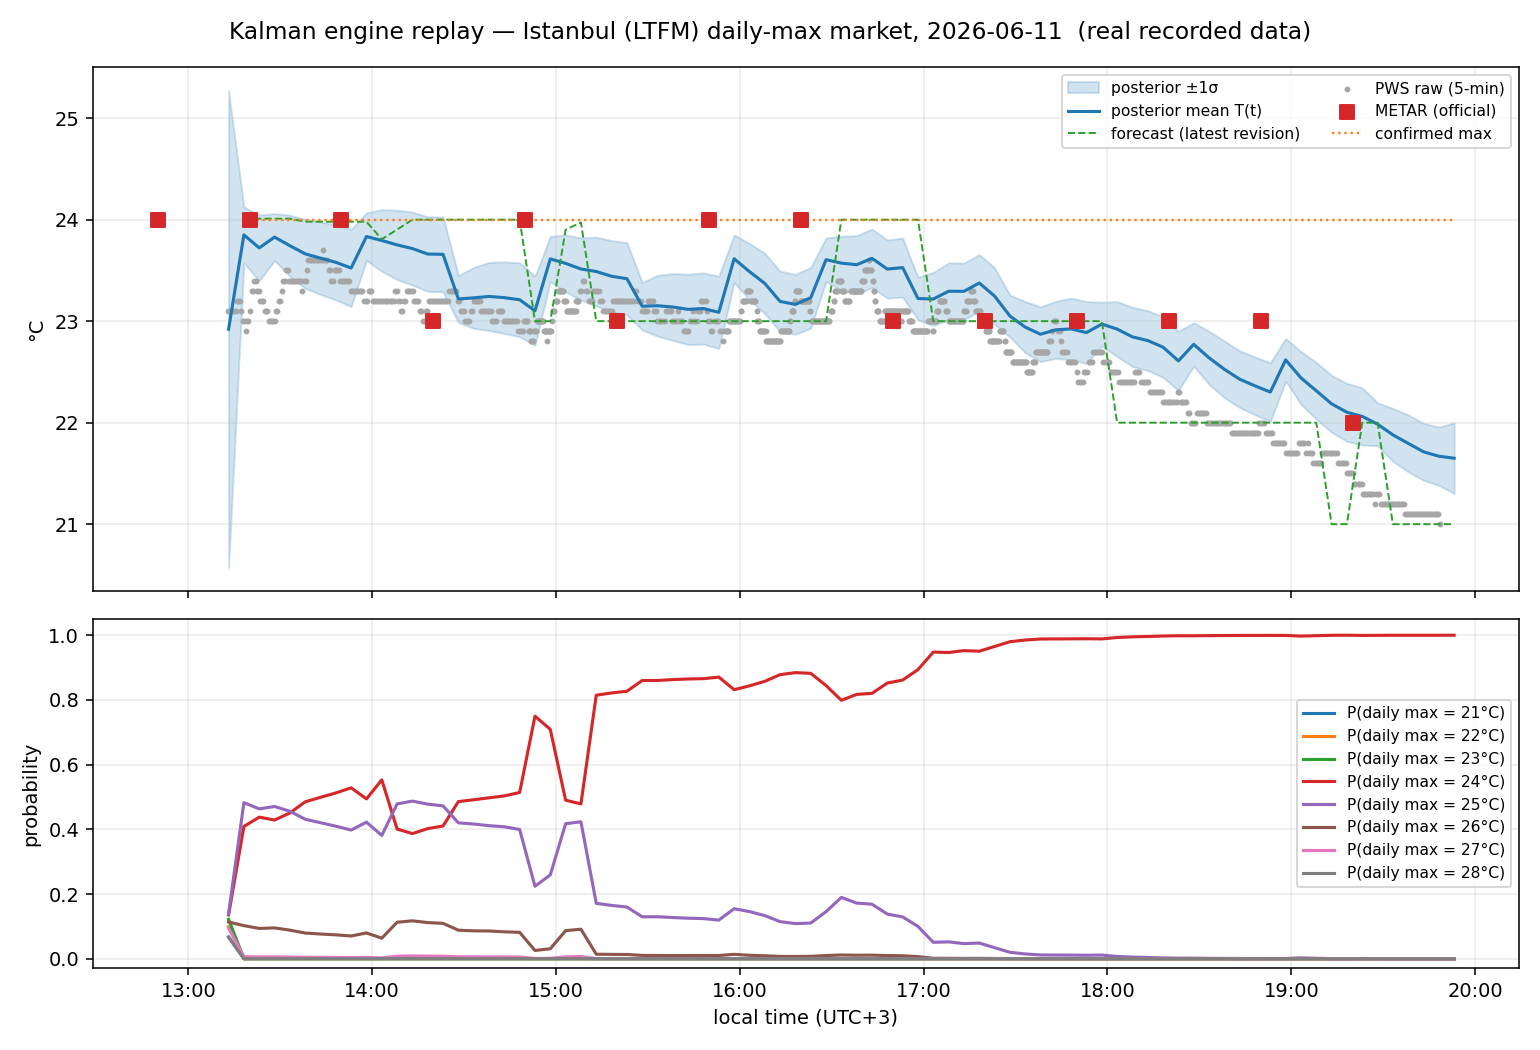
This figure demonstrates the model's behavior on one day. Forecasting scores belong to the separate studies above. Sensor-derived maxima and contractual settlement are also distinct; the individual market rule determines the latter. The model notes explain its conditional-distribution consistency check and why a per-bucket error differs from a summed L1 diagnostic.
Read and reproduce
Start with the observation-to-decision walkthrough. Use the engineering examples to inspect polling and preparation with local fixtures, or the research audit to check released historical score calculations.